Market Spotlight: Oklahoma City, Oklahoma
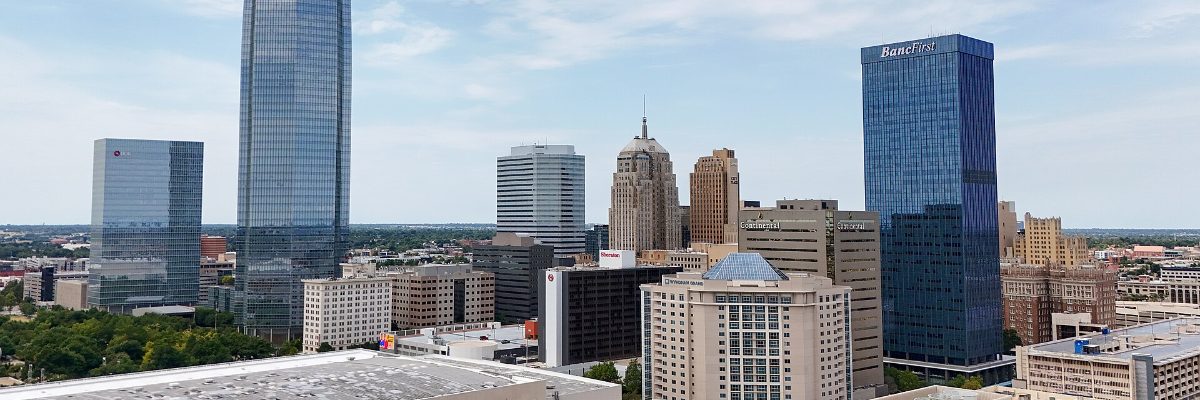

Market spotlights look at one market that stands out on the numbers — not a "buy here now" call, just a look at what the current data actually shows, drawbacks included. This one: Oklahoma City, where population, payrolls and rents are all moving in the same direction at once — a rarer alignment than it sounds — and where the binding constraint is an operating expense rather than a demand problem.
Why Oklahoma City
Most markets that screen well do so on one or two variables while something else quietly works against them. Oklahoma City is unusual in that the whole set lines up. Census estimates put the metro at 1,512,813 as of July 2025, up 13,745 people or 0.92% in a year. Bureau of Labor Statistics data show nonfarm payrolls up 0.7% year over year as of August 2026, and the direction matters as much as the level — that figure was negative as recently as March 2026, so the trend is improving rather than rolling over. Unemployment sat at 4.3% in July.
The housing data tells a consistent story. The median sale price is essentially flat, down 0.43% year over year, which is arguably the healthiest reading available: neither the decline that signals a market losing its bid nor the froth that erodes entry yield. Homes are taking 57 days to leave the market, five days longer than a year earlier, though they still sell at 98.3% of list with a fifth going above asking. And rents are actually rising, up 1.76%, which was not true of most comparable metros this year.
| Median sale price (city) | $274,818 |
| Price growth, year over year | -0.4% |
| Median days on market | 57 days |
| Sale-to-list ratio | 98.3% |
| Share selling above list | 20.0% |
| Single-family asking rent | $1,569/mo |
| Rent growth, year over year | +2.2% |
| Active listings, year over year | +7.8% |
| Single-family permits, year over year | +12.3% |
Unfamiliar with a term in this table? The glossary defines median sale price, days on market, sale-to-list ratio, ZORI and the rest of the market-data vocabulary used here, and says which measure each figure uses.
The rent figure is Zillow's single-family series, which covers single-unit homes only and excludes apartment buildings; it measures asking rent rather than signed leases, and it is a metro-wide figure, so a specific neighborhood will run its own number. Pull an actual comp set before underwriting a real deal; our guide to finding reliable numbers covers how.
Supply is expanding — listings up 7.8% and single-family permits up 12.3% — so this is not a constrained market propped up by scarcity. Days on market have lengthened by only five days against that added supply while sale-to-list has held above 98%, which suggests demand is broadly keeping pace rather than being overwhelmed — the more durable version of a balanced market, though the direction is worth watching rather than assuming.
The catch: insurance, and a tax cap that resets when you buy
Oklahoma is among the most expensive states in the country to insure a home, and on an entry price this modest the premium is a larger share of gross rent than almost anywhere else. The regulators' own data — NAIC average premiums for homeowners policies, 2022 data year — put Oklahoma at $2,268 against a national average of $1,569, fourth-highest in the country. Quote-based surveys at fixed coverage levels put it first outright, with LendingTree reporting $6,133 against $2,801 nationally. Those two families of numbers are not comparable: the first divides aggregate written premium by house-years of exposure on policies in force, the second reports quoted premiums at a specific, relatively high coverage level. Both say the same thing about direction. Note too that all of these are owner-occupied policies; a landlord dwelling-fire policy is priced differently, so treat them as evidence of the state's catastrophe exposure rather than as your quote.
The second item is quieter and catches almost every out-of-state buyer. Oklahoma limits annual increases in a property's fair cash value — market value, which the county ratio is then applied to — but not equally: the Tax Commission's rule implementing the state constitution caps homestead and agricultural property at 3% a year and all other property, including your rental, at 5%. More consequentially, that limitation does not apply in a year when title is transferred — on sale, the parcel is assessed at fair cash value. Whatever cap protection accumulated under the previous owner is erased at closing, so a pro forma built from the seller's current tax bill will understate year-one taxes.
One timely note: State Question 847 is on the ballot on November 3, 2026, and would tighten those caps to 1.75% for homesteads and 4% for everything else from 2027. That narrows the cap for rentals in absolute terms while widening the gap between homeowner and investor treatment. As this publishes the measure is pending, so treat it as a known unknown rather than assuming an outcome.